ICHRA in New York 2026: NYC Wins, Six Counties Don't
New York's 2026 individual market beats small group in 41 of 62 counties, including all five boroughs. See where it falls short, and why.
The short version
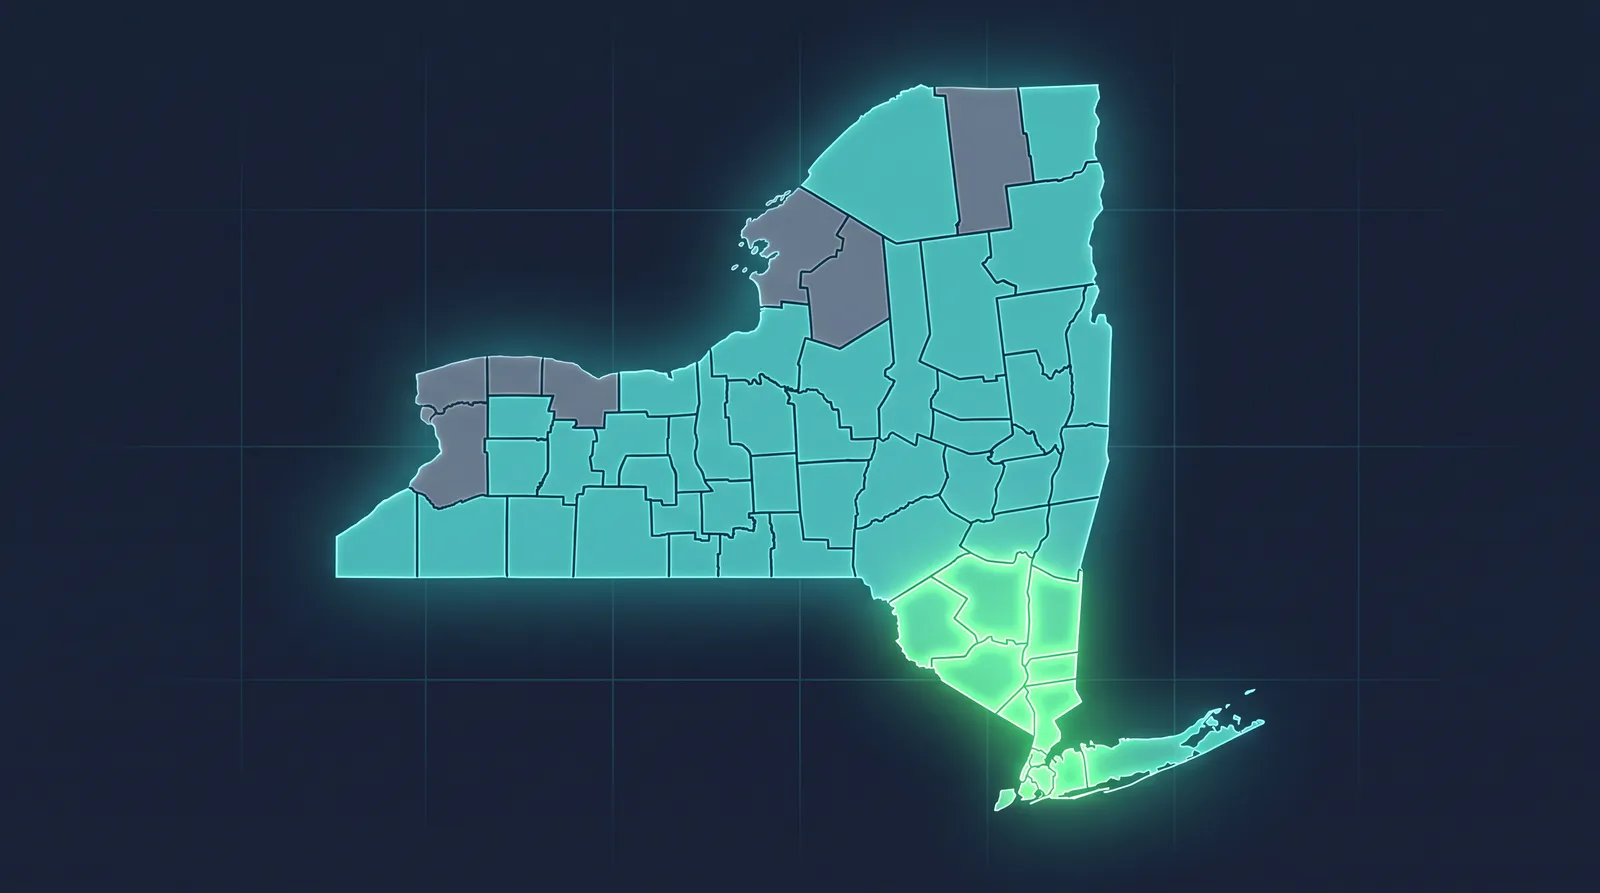
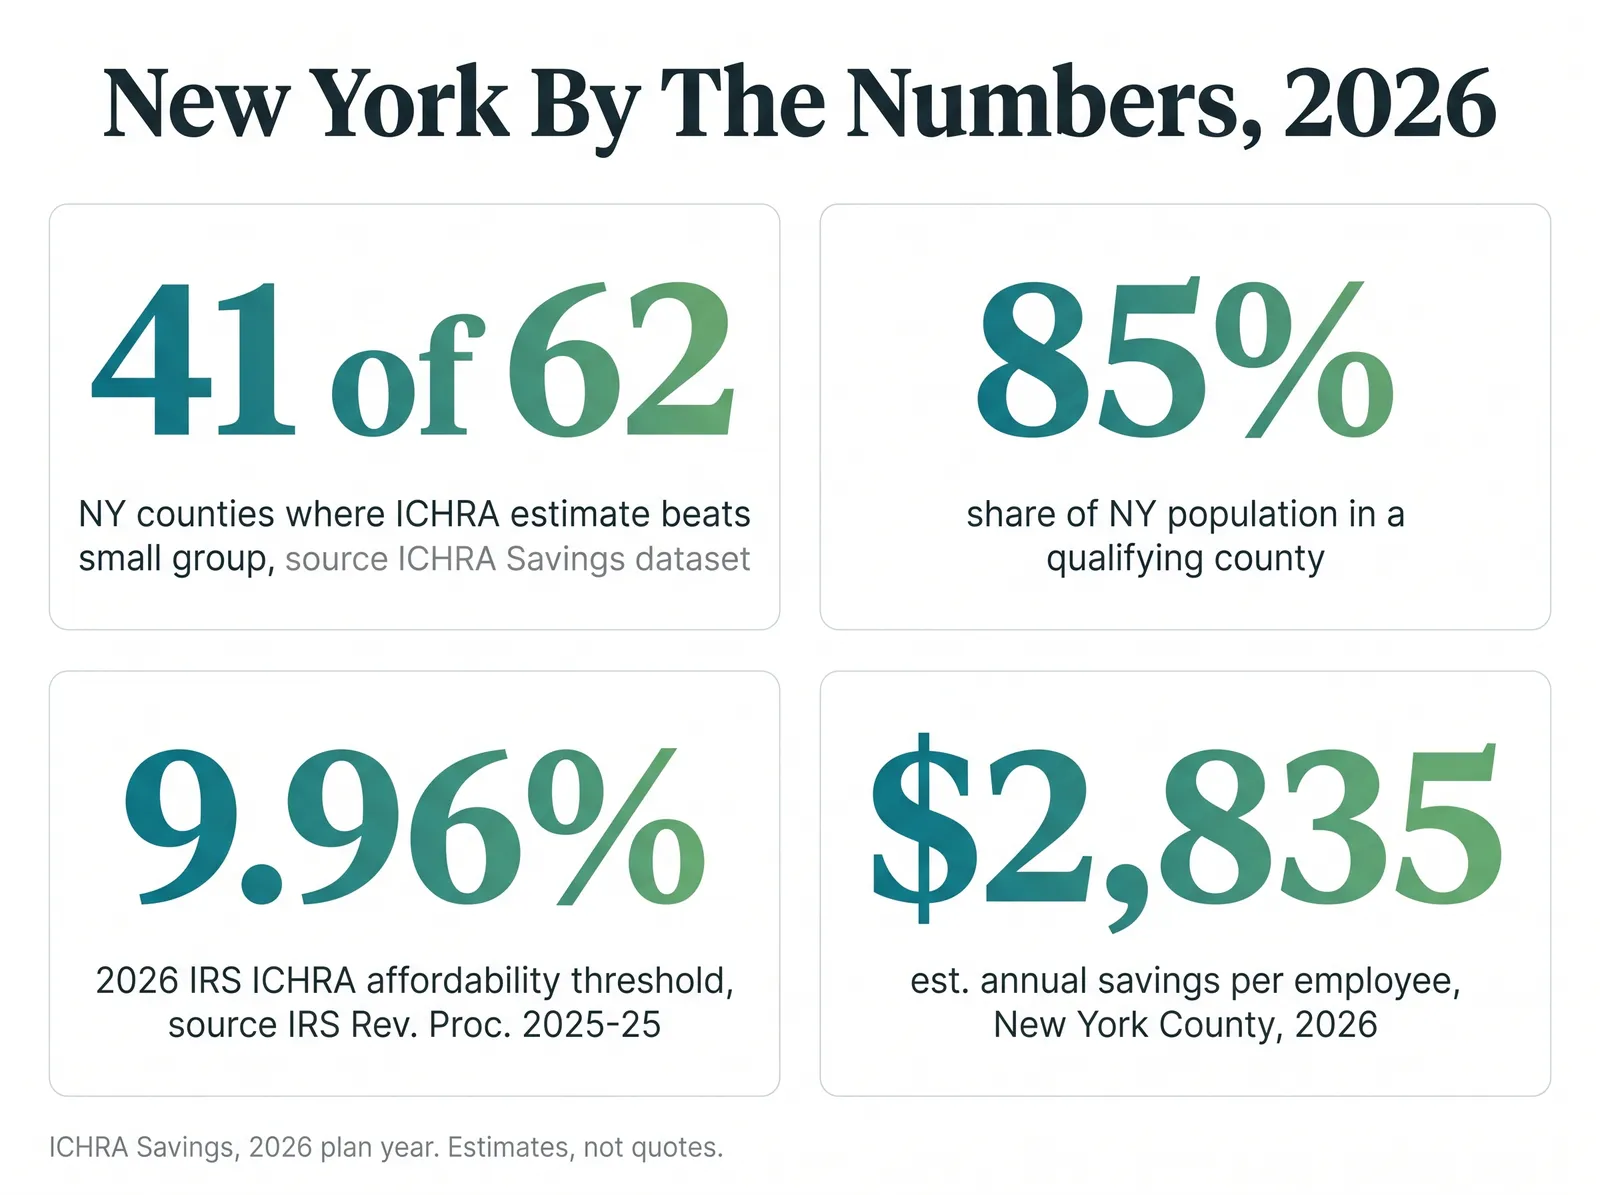
- ICHRA clears the qualifying bar in an estimated 41 of New York's 62 counties for 2026, covering roughly 85% of the state's population.
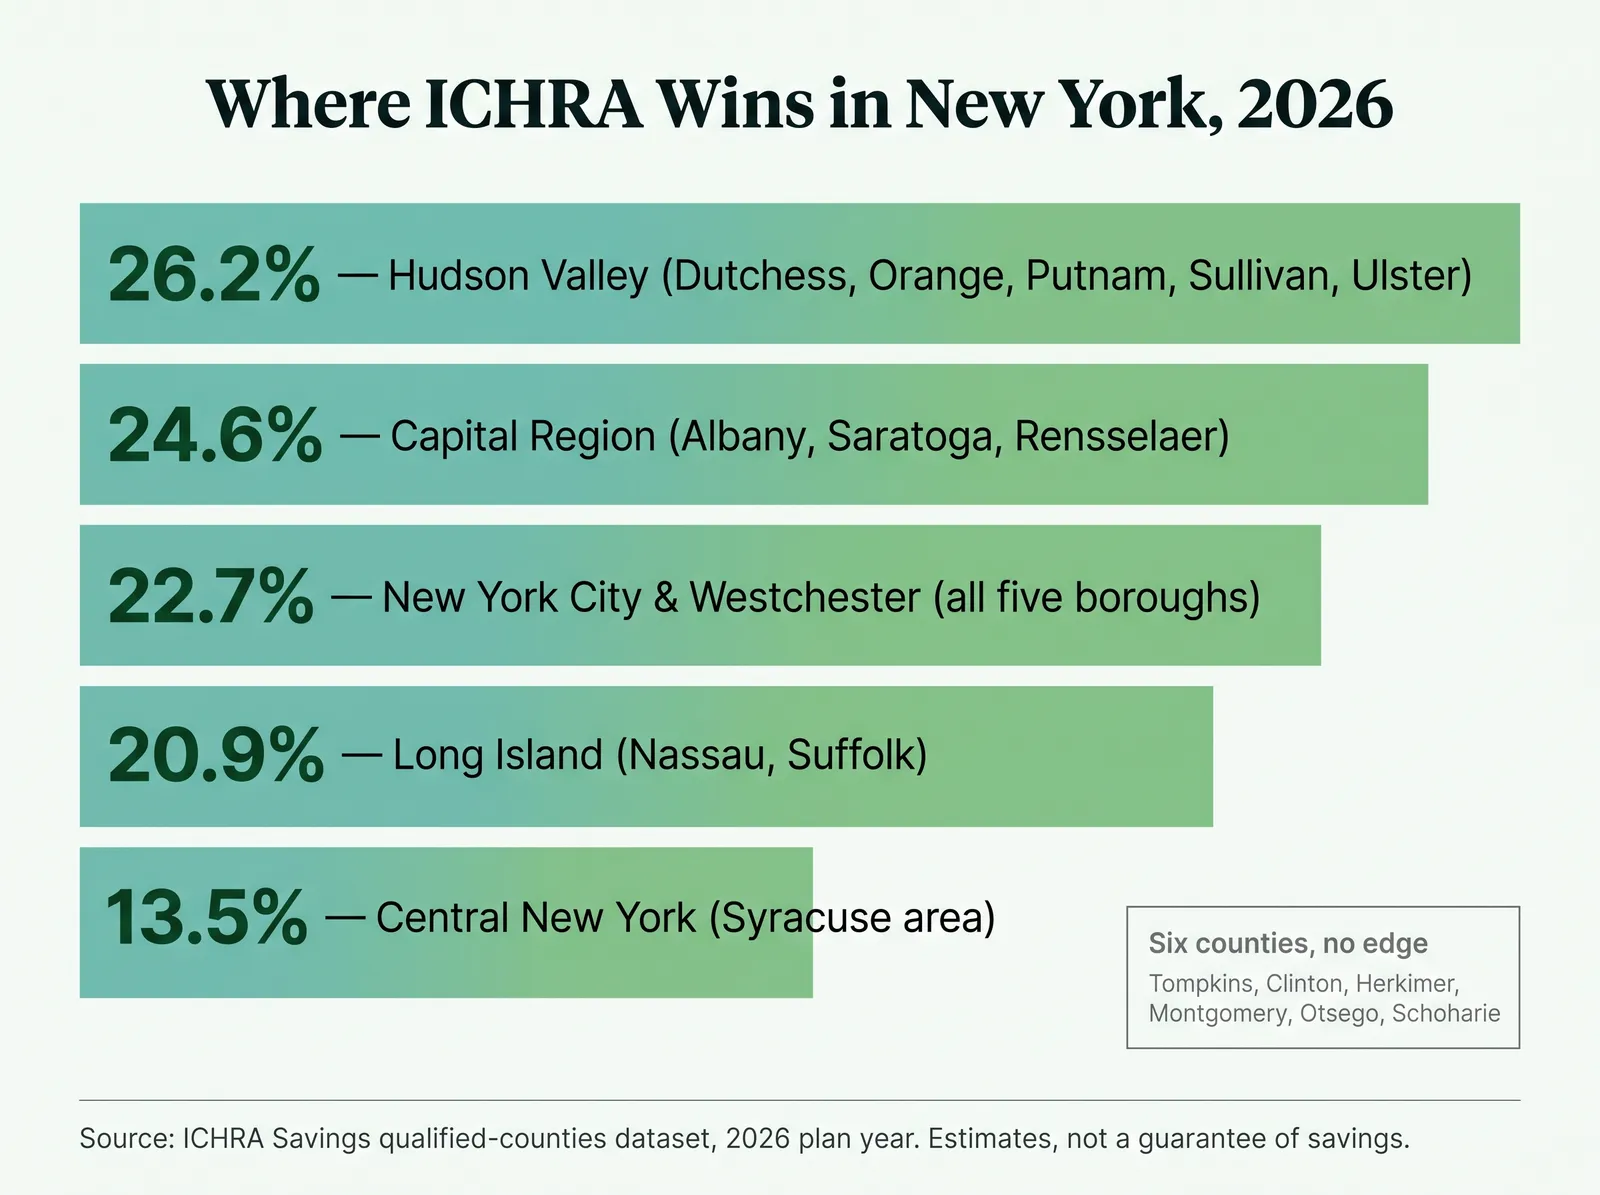
- All five New York City boroughs, plus Westchester and Rockland Counties, qualify at 22.7%. The widest margin in the state, 26.2%, belongs to the mid-Hudson Valley: Dutchess, Orange, Putnam, Sullivan, and Ulster Counties.
- Only 6 counties, all upstate, show no individual-market cost edge at all for 2026: Clinton, Herkimer, Montgomery, Otsego, Schoharie, Tompkins.
- The 2026 IRS affordability threshold is 9.96% of household income: the number that decides whether an employee's ICHRA is considered affordable.
Does ICHRA beat small group in New York?
In most of the state, yes, including its biggest county by population. An ICHRA (Individual Coverage Health Reimbursement Arrangement) clears our $100-a-month-per-employee qualifying bar in an estimated 41 of New York's 62 counties for the 2026 plan year, based on a county-by-county comparison of individual-market and small-group benchmark premiums. Those 41 counties make up about 3% of the 1309 counties nationwide where the math currently favors ICHRA, and cover an estimated 85% of New York's population.
If you haven't worked through the general decision yet, our ICHRA vs. small group decision guide walks through the framework this article applies specifically to New York. Here's what a simple "New York qualifies" headline hides: in most states we've covered on this site, the biggest metro is the weak link, the county where the individual-market discount thins out or disappears entirely. New York runs the other way. Kings County (Brooklyn), Queens County, New York County (Manhattan), the Bronx, and Staten Island all clear an estimated 22.7%, and Nassau and Suffolk Counties on Long Island clear 20.9%. The state's rural fringe, not its largest city, is where the case gets thin.
41 of 62
New York counties clearing the qualifying bar for 2026
85%
Share of New York's population in a qualifying county
19.3%
Average estimated savings across qualifying counties
$2,174
Average estimated savings per employee, per year
Why New York prices health insurance differently
Most states let individual-market insurers price a plan lower for a healthy 27-year-old than for a 55-year-old, and price small-group plans on a blended, composite basis for the whole group. New York doesn't allow either kind of underwriting. Under New York Insurance Law § 3231, "no individual health insurance policy and no group health insurance policy covering between one and fifty employees... or between one and one hundred employees... shall be issued in this state unless such policy is community rated," meaning every enrollee in a given policy form pays the same premium, "without regard to age, sex, health status, tobacco usage or occupation." New York has required this since 1993, years before the ACA made a weaker version of community rating a national baseline.
On top of that state law, both the individual and small-group markets are split into eight CMS-defined geographic rating areas that group New York's 62 counties into regions rather than pricing each county on its own. Rating Area 4, the New York City region, covers Queens, Richmond, Rockland, New York, Kings, Bronx, and Westchester Counties. Rating Area 3 covers Delaware, Dutchess, Orange, Putnam, Sullivan, and Ulster. That's why, in the data below, entire clusters of counties post the identical individual-market benchmark premium: they're the same rating area, priced once.
New York's insurance regulator, the Department of Financial Services (DFS), also runs one of the country's more active prior-approval processes. For the 2026 plan year, DFS's own August 29, 2025 announcement states that the agency "reduced insurers' requested rates 47.4%" in the individual market and "reduced insurers' requested rates 45.8%" in the small-group market, a combined $959 million held back from what carriers originally filed for, split roughly $148.2 million in the individual market and $810.8 million in small group. DFS also capped insurers' built-in profit provision at 1.0% for 2026. None of that changes the underlying spread between individual and small-group premiums that this article is about, but it does mean New York's regulator is actively narrowing both markets' increases before this dataset's benchmark premiums are ever set.
Why this matters for the ICHRA math
Community rating removes the single biggest lever that makes ICHRA a clear win in most other states: a young, healthy employee buying an individual plan at an age-rated discount. In New York, every enrollee in a rating area pays the same individual-market premium regardless of age. The savings this dataset finds instead come from a different source: New York's small-group benchmark premiums run higher than its individual-market benchmark premiums in the same rating area, for most, but not all, of the state.
New York's eight rating areas, side by side
Because both markets price by CMS-defined geographic rating area rather than by individual county, the fastest way to understand New York's ICHRA math is to look at all eight regions at once. Each row below uses a representative county from that region; every other county sharing the same rating area posts the identical individual-market benchmark premium, and in most areas the identical small-group benchmark and savings percentage too.
| Rating area | Representative counties | Savings vs. small group | Est. annual savings / employee |
|---|---|---|---|
| Area 1 — Capital Region | Albany, Saratoga, Rensselaer, Columbia, Greene, Warren, Washington | 24.6% | $2,658 |
| Area 2 — Western New York | Erie, Niagara, Chautauqua, Cattaraugus, Genesee, Orleans, Wyoming, Allegany | 7.4% | $562 |
| Area 3 — Mid-Hudson | Dutchess, Orange, Putnam, Sullivan, Ulster, Delaware | 26.2% | $3,421 |
| Area 4 — New York City | All five boroughs, plus Westchester and Rockland | 22.7% | $2,836 |
| Area 5 — Finger Lakes | Monroe, Ontario, Livingston, Seneca, Wayne, Yates | 10.5% | $1,025 |
| Area 6 — Central New York | Onondaga, Broome, Cayuga, Chemung, Cortland, Schuyler, Steuben, Tioga, Tompkins | 13.5% | $1,275 |
| Area 7 — North Country / Mohawk Valley | Oneida, Jefferson, St. Lawrence, Chenango, Clinton, Essex, Franklin, Hamilton, Lewis, Madison, Oswego, Otsego | 13.9% | $1,362 |
| Area 8 — Long Island | Nassau, Suffolk | 20.9% | $2,717 |
Two of the eight, Area 3 (Mid-Hudson) and Area 4 (New York City), sit at the top of the state's range, while Area 2 (Western New York) sits at the bottom. Not every county inside a region matches its neighbors exactly, and the six no-edge counties sit inside Area 1, Area 6, and Area 7 rather than forming a rating area of their own; the next section breaks out those exceptions by name.
All 62 counties, three tiers
New York has 62 counties (the five New York City boroughs are each their own county), and this dataset sorts them into three groups for 2026: 41 that clear the $100-a-month qualifying bar, 15 that show a smaller, real discount but fall short of it, and 6 that show no individual-market cost edge over small group at all. Savings across the 41 qualifying counties run from 13.5% up to 26.2%, averaging 19.3%.
| County | Population | Savings vs. small group | Est. annual savings / employee |
|---|---|---|---|
| Kings County | 2,679,620 | 22.7% | $2,836 |
| Queens County | 2,360,826 | 22.7% | $2,836 |
| New York County | 1,645,867 | 22.7% | $2,836 |
| Suffolk County | 1,524,486 | 20.9% | $2,717 |
| Bronx County | 1,443,229 | 22.7% | $2,836 |
| Nassau County | 1,389,160 | 20.9% | $2,717 |
| Westchester County | 997,904 | 22.7% | $2,836 |
| Richmond County | 492,925 | 22.7% | $2,836 |
| Onondaga County | 472,637 | 13.5% | $1,275 |
| Orange County | 401,237 | 26.2% | $3,421 |
Look at that table closely: eight of New York's ten most populous counties qualify, and the only two large counties missing from it, Erie (Buffalo) and Monroe (Rochester), fall into the thin-margin tier rather than the no-edge one. That's the opposite pattern from most states this site tracks, where a big, competitively priced metro individual market is usually the reason a large county falls short. New York's biggest counties by population are, on this measure, its strongest ICHRA counties.
Erie County's 7.4% and Monroe County's similarly thin figure aren't weak because those metros are unusually cheap on the individual side; Rating Area 2 (Western New York) and Rating Area 5 (Finger Lakes) simply carry a smaller gap between their individual and small-group benchmarks than Rating Areas 1, 3, 4, and 8 do. A Buffalo-based employer shouldn't read a low headline percentage as "ICHRA doesn't work here." A 7.4% spread is still a real, positive number worth about $562 a year per employee; it's simply a thinner case than a Brooklyn or Poughkeepsie-based employer would see, and worth weighing against the administrative cost of running the plan correctly for a small group.
How New York's 62 counties break down by savings tier
Number of counties in each band, 2026 plan year. Source: repo county dataset.
The remaining 6 counties (not shown) have no individual-market cost edge over small group at all for 2026. Illustrative and rounded; not an offer of insurance or a guarantee of savings.
See the full New York savings breakdown for every qualifying county, or the national savings map to check a specific county by name.
Why New York City clears the bar
New York County's 2026 individual-market benchmark runs $807 a month against a small-group benchmark of $1,043, a gap of $236, or 22.7%, worth about $2,836 a year per employee. Kings, Queens, Bronx, and Richmond Counties, plus Westchester, post the exact same figures, because all seven sit in CMS Rating Area 4. That uniformity is the tell: it isn't that Manhattan specifically has cheap individual insurance, it's that the whole New York City rating region prices small-group coverage high enough, relative to its own individual-market benchmark, to clear our bar.
Nassau and Suffolk Counties, Long Island's Rating Area 8, clear a narrower 20.9%, still worth $2,717 a year per employee. Our sister article on how rating areas create identical premiums across different counties walks through the general mechanism in more depth, using Ohio as the example; New York applies the same CMS rating-area structure, layered under its own state community-rating law.
New York doesn't have one ICHRA story. It has a Hudson Valley story at 26.2%, a five-borough story at 22.7%, and a Tompkins County story that doesn't clear the bar at all. All three are true at once.
Mike MooreA worked example: Manhattan versus Tompkins County
Here's what the county-level math actually looks like for a small employer with a split New York workforce. Assume a 20-employee company with 12 employees in New York County (Manhattan) and 8 employees in Tompkins County (Ithaca).
Here's the math
In New York County, the 2026 individual-market benchmark premium runs $807 a month against a small-group benchmark of $1,043, a savings of $236 a month, or $2,836 a year per employee. Tompkins County isn't in our qualifying dataset at all for 2026: its 2026 individual-market benchmark does not run below its small-group benchmark, so this analysis shows no cost edge there.
For this hypothetical 20-person company: 12 employees x $2,836 (Manhattan) + 8 employees x $0 (Tompkins) = an estimated $34,029 a year in aggregate savings using benchmark-level ICHRA contributions across the whole workforce. Every dollar of that total comes from the 12 Manhattan employees; the Tompkins County share of the workforce, 40% of headcount, contributes nothing to it under this dataset. This is an illustrative estimate using real county rate data and a hypothetical headcount split; your actual result depends on your employees' ages, exact counties, and the plan levels they choose.
Notice what this example does not do: claim a single statewide "New York saves X%" figure. A headline like that would blur the fact that an employer whose team sits mostly in Tompkins, Clinton, Herkimer, Montgomery, Otsego, or Schoharie County is looking at a very different answer than one whose team sits in any of the five boroughs. Checking counties individually, not trusting a state average, is the entire argument for county-level data.
The affordability test, in plain numbers
Every ICHRA has to clear the IRS's affordability test to avoid pushing an eligible employee's premium tax credit decision the wrong way. Under IRS Revenue Procedure 2025-25, the required contribution percentage for plan years beginning in 2026 is 9.96% of household income. In plain terms: an employer's ICHRA is considered affordable for an employee if that employee's own required monthly contribution toward the lowest-cost silver plan in their rating area doesn't exceed 9.96% of their household income, divided by 12.
Here's the math on affordability
Take a Bronx County employee earning $34,000 a year. Under the 2026 required contribution percentage of 9.96%, their household's monthly contribution toward the lowest-cost silver plan is considered affordable if it doesn't exceed $282.13 a month (9.96% of $34,000, divided by 12). New York City's Rating Area 4 individual-market benchmark premium runs near $807 a month; if the employer's ICHRA contribution covers, say, $600 of it, the employee's remaining share is well under $282.13, so the ICHRA is affordable for this employee, meaning they must waive the premium tax credit to use it. A smaller contribution can still clear the line for a mid-income employee; a lower-income employee needs a bigger contribution to reach the same result. Modeling this test against your actual census, not a rule of thumb, has to happen before you set a contribution amount.
The subsidy trade-off, stated plainly
Taking an ICHRA is not free money layered on top of a marketplace subsidy. Per HealthCare.gov's own guidance on individual coverage HRAs: if an employer's offer is considered affordable, the employee and their household members "won't be eligible for the premium tax credit on Marketplace coverage, even if they don't use the Health Reimbursement Arrangement." If the offer isn't considered affordable, the employee can choose between the ICHRA and the premium tax credit, "but not both": to get the premium tax credit, they have to decline the ICHRA offer entirely. New York runs its own exchange, NY State of Health, rather than HealthCare.gov, but the underlying federal rule about the ICHRA-versus-tax-credit choice is identical.
That distinction between "offer exists" and "offer is affordable" is where most of the real employee confusion shows up. An employer that sets a modest ICHRA contribution, one that doesn't cover most of the benchmark premium, may end up with an offer the IRS test still treats as unaffordable for lower-income employees, in which case those employees keep the option to shop NY State of Health with a premium tax credit instead of using the ICHRA at all. A higher-income employee at the same company, whose required contribution share is a smaller fraction of income, might see the identical offer treated as affordable, and lose access to the credit. The same ICHRA design can land differently for two employees in the same office, which is exactly why the affordability math has to run per employee, not once for the whole company.
Say this plainly to employees
Taking an employer's ICHRA contribution generally means an employee waives the federal premium tax credit for that month, unless the ICHRA is unaffordable under the IRS test, in which case they can decline it and keep shopping the marketplace with a subsidy instead. Enhanced federal premium tax credits expired at the end of 2025 and the underlying 400% federal poverty line subsidy cliff is back for 2026, a separate topic we cover in full in our ACA subsidy cliff guide. The 2026 federal poverty guideline for a one-person household is $15,960 (HHS, Federal Register, Annual Update of the HHS Poverty Guidelines, Jan. 15, 2026), the baseline that feeds the separate FPL safe harbor some employers use instead of the household-income test above.
How ICHRA Savings helps
None of the county math above requires talking to anyone. The savings map lets you look up every New York county by name and see the same individual-market and small-group benchmark premiums used in this article, so you can check whether your specific workforce sits inside a strong-margin county like Dutchess or Kings, a thin-margin one like Erie, or one of the six that don't clear the bar at all, before you spend time on anything else. Beyond the map, we help employers design and set up an ICHRA: building employee classes correctly, modeling affordability against your real census instead of a rule of thumb, and getting the required employee notice right and on time. We don't pick your employees' plans for them; that decision, and the choice of network, stays with each person buying their own coverage. Our part is the budget, the design, and the compliance scaffolding around it.
Before anything else, check whether your county is one where this works well: https://ichrasavings.com/ichra-savings-map/. Ten minutes there tells you whether the rest of this process is worth starting, and whether your county lands closer to Dutchess's 26.2% or Tompkins's no-edge result.
One more wrinkle worth flagging for New York specifically: a remote or multi-office employer with staff split across, say, Manhattan and the Hudson Valley isn't looking at one number. Each rating area prices differently, and an employee working from a Capital Region home office three days a week has a different county of record than one commuting into a Manhattan headquarters daily. Pull each employee's actual county, not the company's mailing address, before modeling a rollout.
This also changes how you think about employee classes. Under the federal ICHRA rule, a "rating area" is itself one of the eleven permitted class-defining factors, alongside full-time versus part-time status, salaried versus hourly work, and a few others. A New York employer with real headcount split between, say, the New York City rating area and the Mid- Hudson rating area could, in principle, define separate classes along those lines and set a different contribution for each, so long as each class meets the minimum-size rule and the same class isn't offered a choice between ICHRA and group coverage. Most small employers don't need to go that far. A single contribution amount applied evenly across the whole company is simpler to administer and still lets each employee shop the plan that fits their own county and household, since the ICHRA dollar amount, not the plan itself, is what varies by class.
Setting up an ICHRA in New York
New York doesn't add state-specific ICHRA design rules on top of the federal framework, but it does add its own market rules that shape what employees are actually buying with their allowance. The setup sequence itself is the same one that applies in any state:
- Pull your census by county, not by office address. A company headquartered in Manhattan with field or remote staff in the Capital Region or western New York has a materially different savings story per location.
- Check each employee's county on the savings map. Don't assume a statewide average applies; a 26.2% county and a no-edge county both technically sit in "New York," but they aren't the same decision.
- Model affordability using the 2026 threshold. At 9.96% of household income, the required contribution percentage sets how much an ICHRA contribution needs to cover to count as affordable.
- Define employee classes carefully, if you use them. An employee class is a group defined by an objective factor the IRS permits, such as full-time versus part-time status, geographic location, or salaried versus hourly work. Class rules carry minimum-size requirements and cannot offer the same class a choice between ICHRA and group coverage.
- Send the required notice on time. Under 26 CFR § 54.9802-4(c)(6), eligible employees generally need written notice at least 90 calendar days before the plan year begins, with specific required content about the offer and its effect on subsidy eligibility.
- Point employees to NY State of Health, not HealthCare.gov. New York runs its own ACA marketplace exchange; employees shopping for individual coverage to pair with an ICHRA allowance need to know that up front.
See our full ICHRA setup timeline for the detailed rollout plan, including the exact notice content requirements, and our guide to ICHRA employee classes if your New York workforce spans more than one rating area.
Run your counties first
Before scheduling a single meeting, look up every county where you have employees on the savings map. If your New York workforce sits mostly inside one of the six no-edge counties, you have a different, more marginal conversation ahead than an employer centered on the five boroughs, Long Island, or the Hudson Valley.
The honest limits of this data
Read this before you commit
- Six counties show no individual-market cost edge at all. Clinton, Herkimer, Montgomery, Otsego, Schoharie, and Tompkins Counties, all upstate, don't appear in our qualifying dataset for 2026 because the individual-market benchmark there doesn't run below the small-group benchmark.
- Fifteen counties show a real discount that falls short of our bar. That includes Erie County (Buffalo) and Monroe County (Rochester) at 7.4% and 10.5%, and Delaware County at just 1.8%, even though its rating-area neighbors sit at 26.2%.
- "Qualifies" isn't a single tier even among the 41 that do. Fulton County clears the bar at 16.8%, worth about $1,645 a year, well below its Capital Region neighbors at 24.6%, despite sharing the same CMS rating area. Both "qualify." One is a much stronger case.
- Rates move every plan year. DFS reduced 2026 requested rates by 47.4% (individual) and 45.8% (small group) before approving them; next year's spread could widen or narrow once 2027 filings are finalized. Recheck before every renewal, not just once.
- These are benchmark comparisons, not a guarantee for your specific workforce. A qualifying county means the benchmark math favors ICHRA; model your actual census, ages, and plan choices before committing.
How these numbers are calculated
Every county figure in this article comes from the same dataset that powers our savings map, not from a survey or a sales estimate. For each of New York's 62 counties, we compare a 2026 individual-market benchmark premium, the second-lowest-cost silver plan available to a representative enrollee, against a small-group benchmark premium built from comparable small-group plan filings for that county's rating area. A county "qualifies" for its own page when the gap between those two benchmarks reaches at least $100 a month per employee; 41 of New York's 62 counties clear that bar for 2026. Another 15 show a smaller, positive gap that falls short of it. The remaining 6 aren't in the underlying dataset at all, meaning the individual-market benchmark in those counties doesn't run below the small-group benchmark for 2026. New York's total county count comes from the U.S. Census Bureau's 2020 county reference file; the state's 2024 population estimate, used to calculate the population share of qualifying counties, comes from the Census Bureau's Population Estimates Program.
Three limitations are worth stating plainly. First, benchmark premiums are built around a representative enrollee profile; because New York community-rates by law, this matters less here than in most states, since age doesn't move the individual-market premium the way it does elsewhere, but household composition and plan choice still do. Second, these are benchmark plans, not every plan on the market; an employee who chooses a richer or leaner plan than the benchmark will see a different premium, though the relative spread tends to hold directionally. Third, rates are filed and refreshed annually, so a county that qualifies for 2026 is not guaranteed to qualify for 2027 once next year's filings are approved. We rebuild this dataset each plan year rather than reusing prior-year figures, and we recommend employers do the same before every renewal.
Questions New York employers actually ask
Does ICHRA beat small-group insurance everywhere in New York?
No, but it clears our $100-a-month-per-employee qualifying bar in an estimated 41 of New York's 62 counties for the 2026 plan year, covering roughly 85% of the state's population. Another 15 counties, mostly in western New York and the Finger Lakes, show a smaller, real individual-market discount that doesn't clear that bar. The remaining 6 counties, Clinton, Herkimer, Montgomery, Otsego, Schoharie, and Tompkins, show no individual-market cost edge over small group at all for 2026.
Why does New York City qualify when other states’ biggest cities usually don’t?
All five boroughs, plus Westchester and Rockland Counties, sit in the same CMS-defined geographic rating area (Rating Area 4) and post an identical estimated 22.7% discount, worth about $2,836 a year per employee. That happens because New York prices individual and small-group health insurance the same way it prices Rating Areas statewide: by region, under a state law that requires community rating (Insurance Law § 3231) rather than by each insurer underwriting a specific county. In most states we've covered, the state's largest metro shows a thinner margin than its smaller counties. New York runs the other way: its eight largest qualifying counties by population are all inside metro New York City or Long Island.
How much can a New York City employer expect to save?
New York, Kings, Queens, Bronx, and Richmond Counties, plus Westchester and Rockland, all clear an estimated 22.7% for 2026, worth about $2,836 per employee per year using benchmark premiums. Nassau and Suffolk Counties on Long Island clear 20.9%, worth about $2,717. That's an estimate built from public rate data, not a quote, and your real number depends on your employees' ages, exact counties, and the plans they choose.
Which New York counties have the widest ICHRA savings for 2026?
Dutchess, Orange, Putnam, Sullivan, and Ulster Counties, the mid-Hudson Valley, tie for the widest margin in the state at an estimated 26.2%, worth about $3,421 a year per employee. Albany, Columbia, Greene, Rensselaer, Saratoga, Warren, and Washington Counties, the Capital Region, follow closely at 24.6%. Both clusters sit in CMS Rating Areas 3 and 1, which is why each county inside them posts the identical figure.
What is the 2026 ICHRA affordability percentage, and why does it matter in New York?
The IRS set the required contribution percentage for plan years beginning in 2026 at 9.96% of household income, under Revenue Procedure 2025-25. It decides whether an employee's ICHRA is considered "affordable," which in turn decides whether that employee must waive their ACA premium tax credit to use it. This is a federal number, the same in New York as anywhere else, but the exact dollar contribution needed to clear it still depends on each employee's household income.
Does New York impose any state-specific ICHRA rules?
ICHRA itself is a federal HRA structure created by a 2019 IRS, DOL, and HHS final rule, and it operates the same way in New York as in any other state. What New York does add is its own community-rating law (Insurance Law § 3231), which governs how the individual and small-group insurance an employee buys with ICHRA funds gets priced in the first place, and its own state-based marketplace, NY State of Health, rather than HealthCare.gov, with its own enrollment window and site mechanics. Standard state insurance-producer licensing still applies to anyone advising employees on plan selection.
Is a county that only qualifies at 13.5% still worth pursuing?
Usually, yes. Onondaga County (Syracuse) and eight others in Central New York clear the bar at an estimated 13.5%, still worth about $1,275 a year per employee, a real number for a small employer. The more useful question is what happens in the 15 counties below the qualifying bar, where gaps run from about $15 to $85 a month per employee, thin enough that it can be swallowed by the administrative cost of running an ICHRA correctly for a very small group. If your workforce sits mostly in Erie County (Buffalo) or one of the other thin-margin counties, the better comparison isn't "ICHRA versus small group," it's "ICHRA versus a taxable stipend versus offering nothing at all."
Where can I check whether my specific New York county qualifies?
Use the savings map to look up any New York county by name. It shows the 2026 individual-market and small-group benchmark premiums side by side, so you can see the estimated spread for your workforce's counties before you model a rollout.
Sources
- New York Department of Financial Services, press release announcing 2026 health insurance premium rates (Aug. 29, 2025; individual market reduced 47.4% from requested, small group reduced 45.8%, combined $959 million held back)
- New York Insurance Law § 3231 (community rating requirement, individual and small-group markets)
- CMS, "New York Geographic Rating Areas" (8 rating areas and their county composition)
- IRS, Revenue Procedure 2025-25 (2026 ACA/ICHRA required contribution percentage, 9.96%)
- HHS / Federal Register, "Annual Update of the HHS Poverty Guidelines" (Jan. 15, 2026; 2026 one-person guideline, $15,960)
- HealthCare.gov, "Individual coverage HRA" (premium tax credit interaction)
- 26 CFR § 54.9802-4(c)(6), Individual Coverage HRA notice requirement
- Federal Register, "Health Reimbursement Arrangements and Other Account-Based Group Health Plans" (84 Fed. Reg. 28888, June 20, 2019; the ICHRA final rule)
- U.S. Census Bureau, 2020 county reference file for New York (62 counties)
- U.S. Census Bureau, Population Estimates Program, "Annual Estimates of the Resident Population" (vintage 2024) (New York population, 19,867,248)
- ICHRA final rule: Departments of the Treasury/IRS, Labor, and Health and Human Services (2020)